
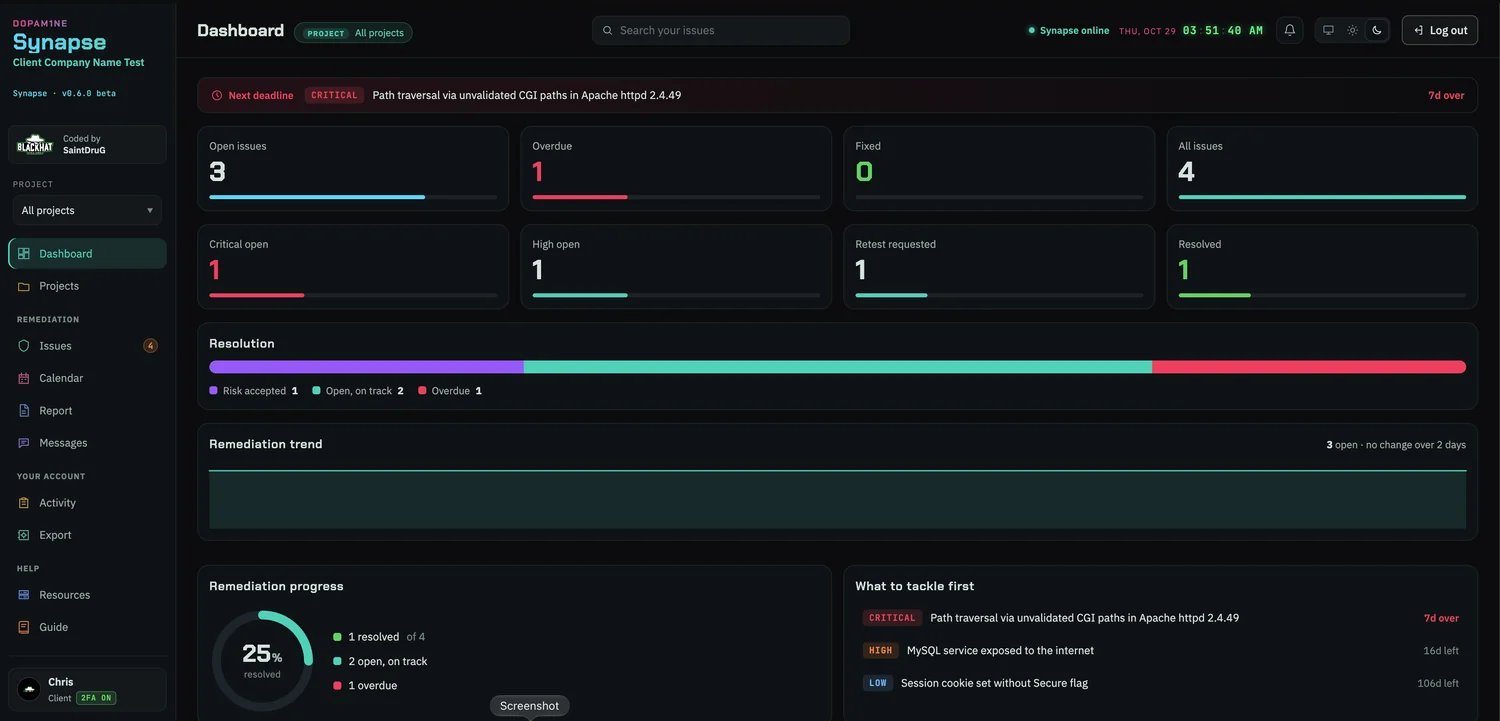
A client's portal overview: their own counts, a resolution split, a progress ring, and a what-to-tackle-first list, scoped to their reported issues.
Live messages from any page
The message icon beside the bell opens your existing issue conversations without leaving the page. New replies show an unread badge and a brief alert. Reply with text or attachments in the drawer, preview images in place, download them, or use Fullscreen. Open issue and Full Messages lead back to the full conversation and its existing history. On phones, the drawer fills the screen. On tablets and desktop, it sits beside your work. Your portal theme applies to the icon, drawer and image viewer. The bell continues to show reported issues, status changes and other updates, while message alerts use the message icon. The Take a tour walkthrough now has a dedicated Message center step, separate from Synapse AI. The portal Guide also explains both features independently. The Synapse AI step tells the client they can ask in their own language and get the answer in it. See the message walkthrough for screenshots and steps.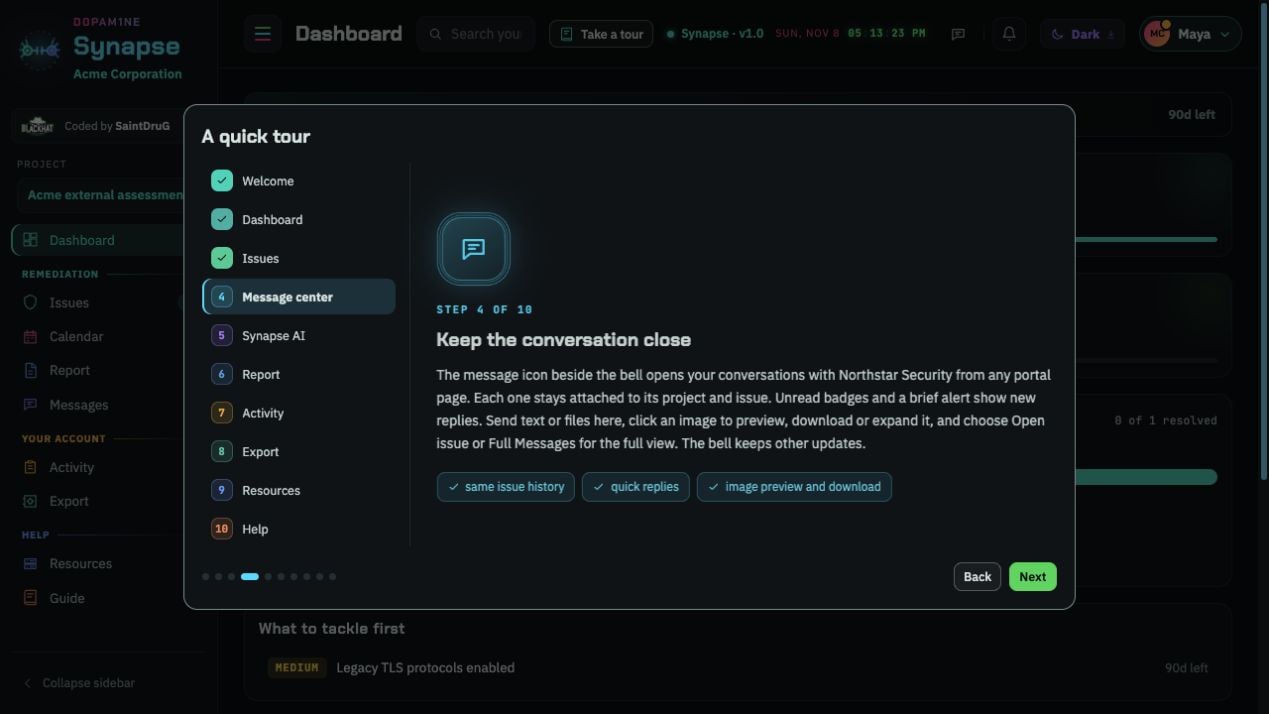
The client tour explains the message icon, shared issue history, attachments and the full conversation views. This screenshot uses fictional test data.
The front door
The portal lives at/portal. Signed out, it shows a Synapse-branded login (not the D0pam1ne console login), and on sign-in a client lands straight in the portal, so a client only ever needs one address. The login carries the Synapse logo and a card naming your firm with its logo, taken from Company identity, beside a short status of the portal (online, whether the connection is encrypted, two-step login required). The sign-in card has a greeting, a show-password eye and a Caps Lock warning. /login stays the team console’s door.
The two sides keep separate sessions in the same browser, so you can be signed into the console and preview the portal at the same time. Signing out of one never signs you out of the other: the portal’s Log out returns to the portal’s own sign-in, and the browser tab shows the Synapse icon while you are in it. Use Preview portal from the console to see the portal exactly as a client would, without a client account.
What a client sees
- Their overview: a dashboard of their own remediation, with the headline counts, a next SLA deadline callout, a Resolution card that pairs a progress ring with the resolved, accepted, on-track and overdue split, two lists side by side, What to tackle first (deadline order) and Highest risk first (ranked by risk), each showing the first few with See all for the full list, then a remediation trend sparkline of open issues over time (it fills in over a day or two) and the status and severity split.
- Their issues: every issue reported to them, grouped by risk with a coloured edge, Critical first, each with its first affected asset under the title, where it is, its status and its deadline. A risk strip beside the Filters button counts each level and filters to it in one click, with an overdue chip next to it; the Filters drawer narrows by status, severity, deadline (any, overdue, on track), site and affected asset, with every option showing how many issues it would leave, options with none dimmed, a search over the affected assets (hosts first, then web addresses, eight shown and the rest a click away) and a footer button that says how many issues match. Export (one menu) downloads what is shown, or the selection, as CSV or JSON. A top search runs over their own issues.
- Their projects, shown as cards when the client has access to more than one: the full project name, the kind of test, a ring of how much is resolved (fixed or accepted), how many issues are still open with chips for the critical, high and overdue ones, the nearest deadline, and an edge in the colour of the most serious open issue.
- Each issue opens with Info, Messages and Retest. Info shows every filled section of the finding, in report order: description, risks, technical description, steps to reproduce, evidence (request/response or tool output), then recommendation, each as read-only formatted text (bold, lists, links and code blocks), with screenshots rendered inline. After the recommendation it shows the Source, the tool that found the issue (nuclei, sqlmap, and so on) or Manual for a hand-created one, then any non-image attachments (PDFs, archives, logs) as a downloadable list, and video evidence as links.
- An Ask tab when your local AI is up, the per-issue Synapse AI assistant.
- A report of their own issues to download, see Reports: PDF, a web page or the interactive report, each in its own colour.
Highest risk first
Near the top of the client’s dashboard, two lists sit side by side so the client sees both what is due and where the risk is:- What to tackle first puts their open issues in deadline order: anything past its agreed deadline first, then whatever is due soonest. Each row shows its status and due date, and how many days are left or over.
- Highest risk first ranks the same open issues by a risk score from 0 to 100, with the reasons in plain words under each one, for example
High severity · internet-facing · on CISA's Known Exploited list.

What to tackle first and Highest risk first on a client's dashboard
External and internal
Every issue is tagged External (the internet-facing surface: websites, APIs, mail, remote access) or Internal (systems inside the client network, each with its site). When a client’s current scope has issues on both sides, the portal shows a Showing bar above the dashboard, issues, calendar and report with an All / External / Internal switch and a count on each side. The choice is remembered in that browser, and everything follows it: the dashboard numbers, the remediation trend, the calendar, the issue list and its search, and the report. A client with issues on one side only never sees the switch.- The dashboard compares the two sides in an External surface and an Internal network tile: open, overdue, critical or high, and how much is resolved. Clicking a tile focuses the portal on that side.
- The issues list adds a Where column with the side and site, and a Site filter in the filter drawer. CSV and JSON exports carry Network and Site.
- Each issue shows a Where it is card: the host’s address and names and, for an internal machine, its device type, operating system, vendor, MAC and site, so the client’s IT team can go straight to it.
- The report follows the switch, and on a project with both sides a Covers choice picks external, internal or both.
Resources and the Guide
Resources is built from the client’s own issues, scoped by the project switcher and the External / Internal switch like every other page:- Fix references: issues grouped by weakness, most serious first. Each group carries a short how-to-fix, the official MITRE CWE page for every weakness in it, the matching OWASP Cheat Sheet where one exists, and the issues it covers (click one to open it). CVEs named in any issue are listed with their NVD page. Every link is built from the id’s fixed URL and every id comes from the issue itself, so nothing is looked up or invented.
- Your files: every screenshot and file your team attached to their issues, newest first, filterable by screenshots or files, each linked to its issue.
- A footprint strip: their issues (and how many are open), the weaknesses with references, the files shared and their size, and when the team last updated something.
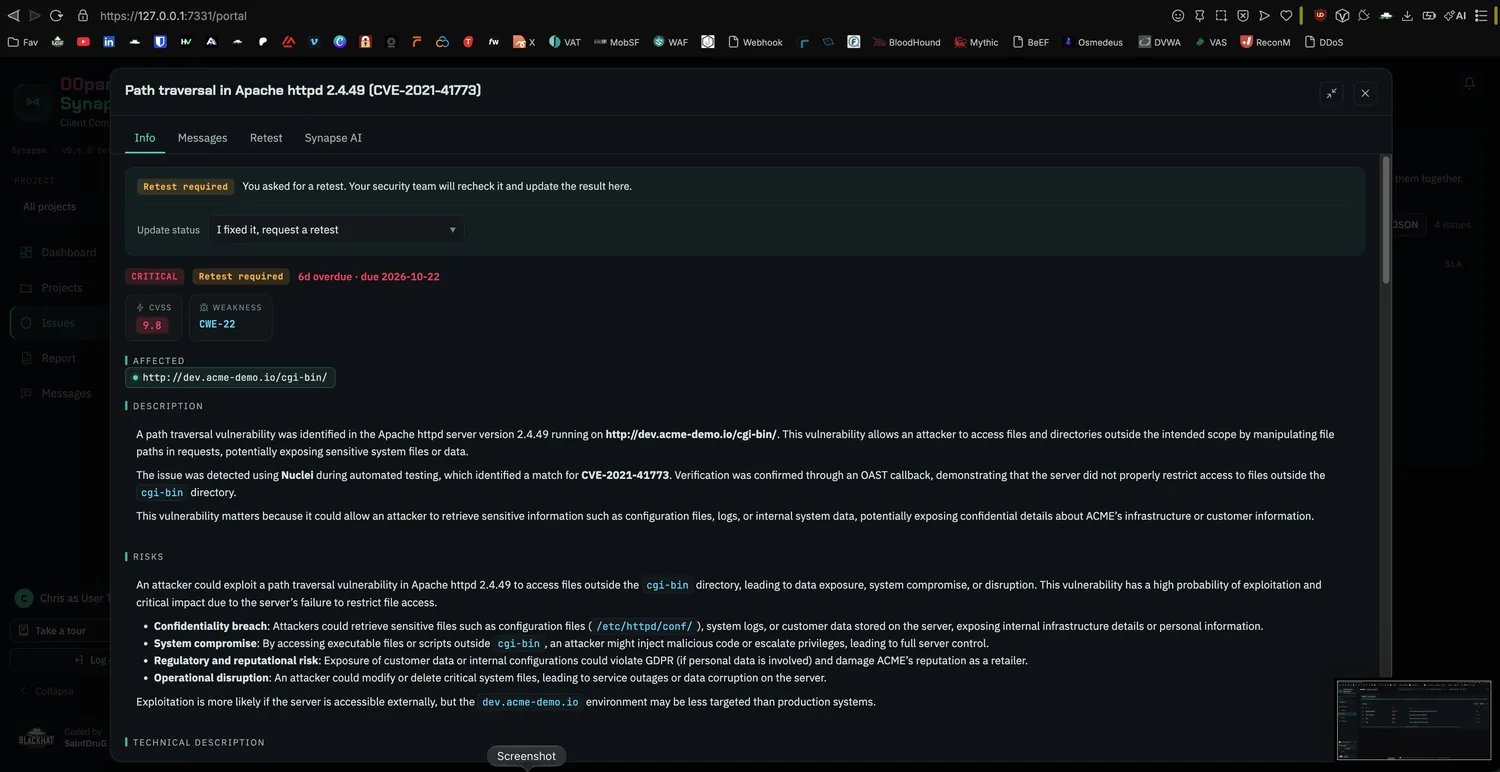
A reported issue in the portal: the status panel and the client's own actions sit above the full finding, CVSS, weakness and affected asset.
Previewing an issue
In the Issues list a client can rest the mouse on an issue to see a small card with its deadline, where it sits, its severity and CVSS, the affected assets and the start of the write-up, then open it in full with a click. The card closes when the mouse moves away and also opens when the client tabs onto a row with the keyboard.The status cluster
The portal top bar carries a small status cluster so a client always knows the service is healthy and can set their own view: the remediation engine state, the version, uptime, a live clock, and the theme button (Follow the system, Light, Dark, Frost, Midnight or Terminal). The portal follows the same theme system as the console but keeps its own choice, so a client’s theme sticks and never follows what is picked in the console on the same browser.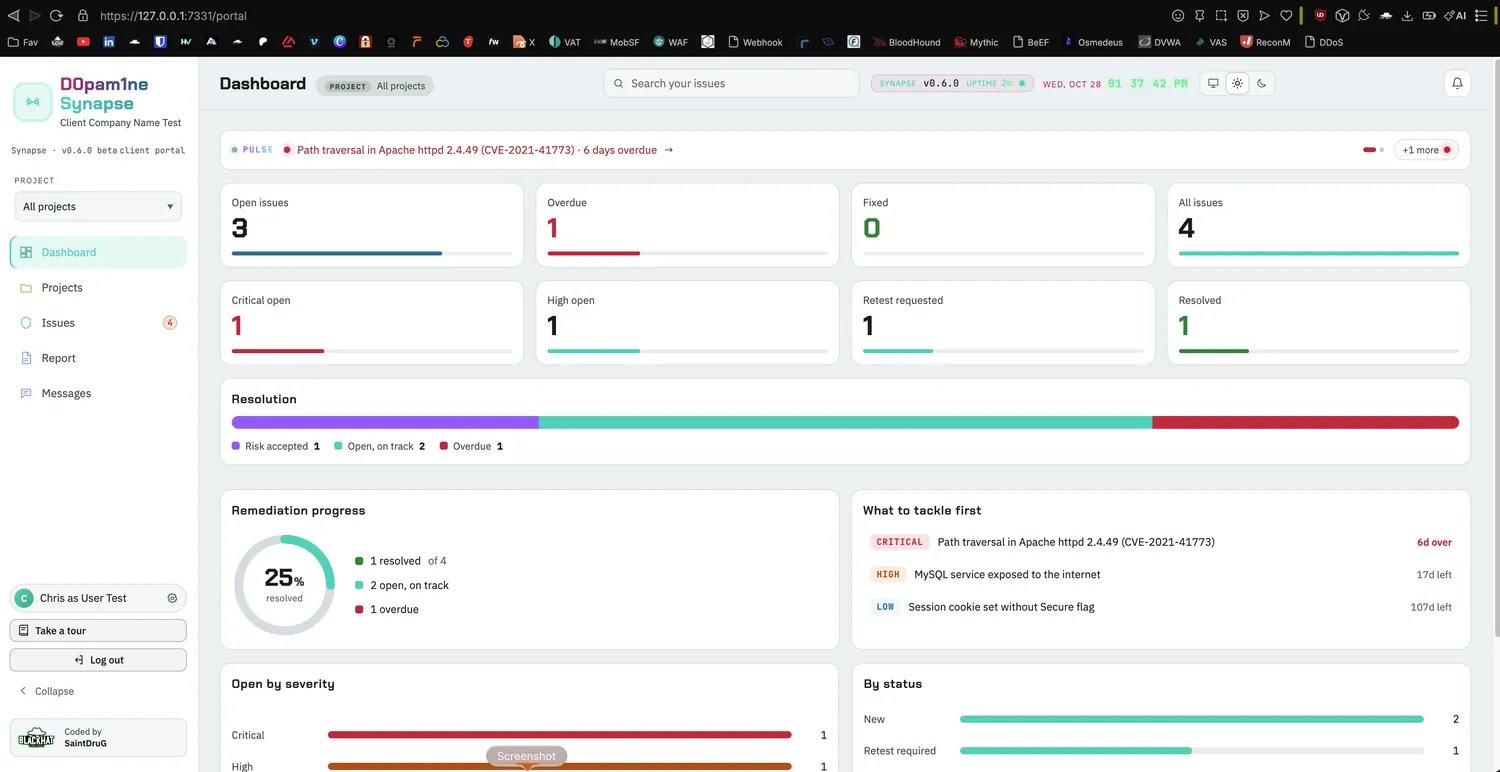
The same portal in light mode: the theme button in the top bar switches the whole portal (Follow the system, Light, Dark, Frost, Midnight or Terminal), and the choice sticks for that client.
Client actions
Every issue opens with a status panel that spells out the current state and the one or two things the client can do about it, so there is never any guessing. A confirmed fix clearly has nothing left to do; an open one shows its actions.- Request a retest: the client marks an issue fixed and asks you to recheck it. On your side it becomes Retest required.
- Mark as fixed (client-confirmed): the client closes an issue on their own responsibility, for example when they decline the paid retest, decommission the affected asset so it is moot, or self-confirm without a retest. It is recorded as client-confirmed (as opposed to team-retested) for the audit trail.
- Accept the risk: the client chooses to accept an issue. On your side it becomes Risk accepted.
- Re-open a fix: if you confirmed a fix but the client finds it is not actually fixed, they can re-open it, which sends it back to Retest required until you retest again.
- Manage their account: from the account menu at the top right (their photo and name, which also opens Activity, Export, the Guide and Log out), the client updates their name and email, changes their password, and turns two-step login on or off (with backup codes). The account page also holds their notification choices and the weekly digest, one email every Monday across all their projects, off until they turn it on. Everything here is the client acting on their own account only.
The portal sidebar
The portal’s left sidebar is grouped into labelled, colour-coded categories, so it stays easy to scan as a client moves around:- Remediation: Issues, Calendar, Report and Messages, the day-to-day remediation work.
- Your account: the client’s own Activity log and a data Export.
- Help: a Resources page and the Guide.
Your activity
The Activity page is a client’s own audit trail, and only theirs: their sign-ins (with where from), their two-step and password changes, and the actions they took on their issues (a requested retest, a self-confirmed fix, an accepted risk, a message). A row of tiles sums it up (today, this week, total sign-ins, last sign-in). Below, each entry reads in plain words (Signed in, Turned on two-step login, Requested a retest) with a coloured icon for its kind, the address and country it came from and when, grouped under Today, Yesterday and earlier dates. Today opens with its first ten entries and a Show more bar for the rest; earlier days start folded to one line with their count and a coloured tally of each kind, and a click opens any of them (Open every day and Fold every day do them all at once). Filter chips narrow it to sign-ins, security, account, issues, or anything that needs a look, such as a failed sign-in. A client only ever sees their own activity here, never anyone else’s.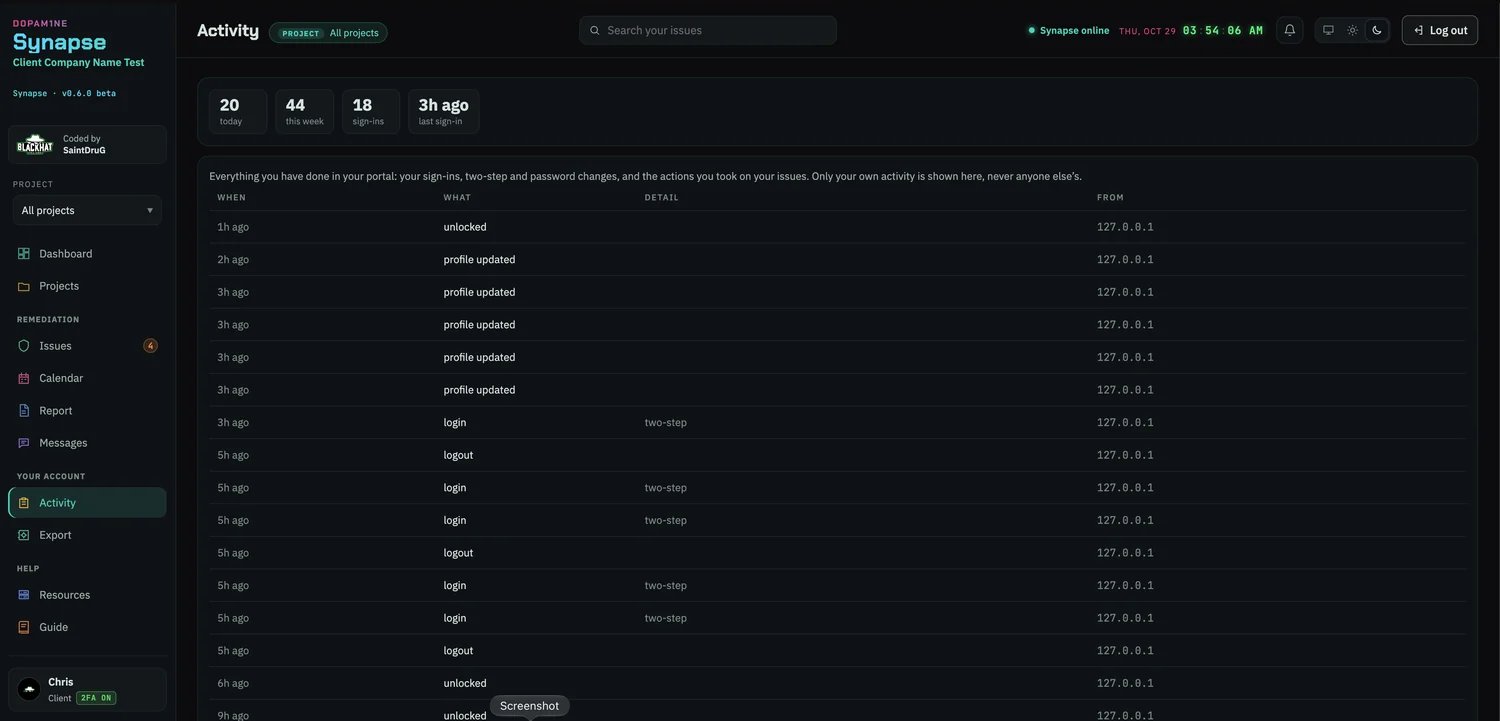
A client's Activity page: their own sign-ins and the actions they took on their issues, with at-a-glance tiles above the log.
Export your data
From Export, a client downloads a copy of their own data whenever they want it: a JSON archive of their account, projects, every issue reported to them (severity, CVSS, weakness, status, deadline, assets and the write-up) and their message threads, or a CSV of just the issues, ready to open in a spreadsheet. Each sits on its own card listing exactly what it contains (the CSV card shows its columns). The file is built in the client’s own browser, so nothing is sent anywhere, and it is only ever their own data. This is an export for the client to keep, open elsewhere, or feed into their own tracking, not a backup to restore. The authoritative copy always lives in your console: your Backups are an encrypted snapshot of everything Pro and Synapse hold, so a restore brings the whole portal state back with it. A client’s export is a convenience for them, never the safety net.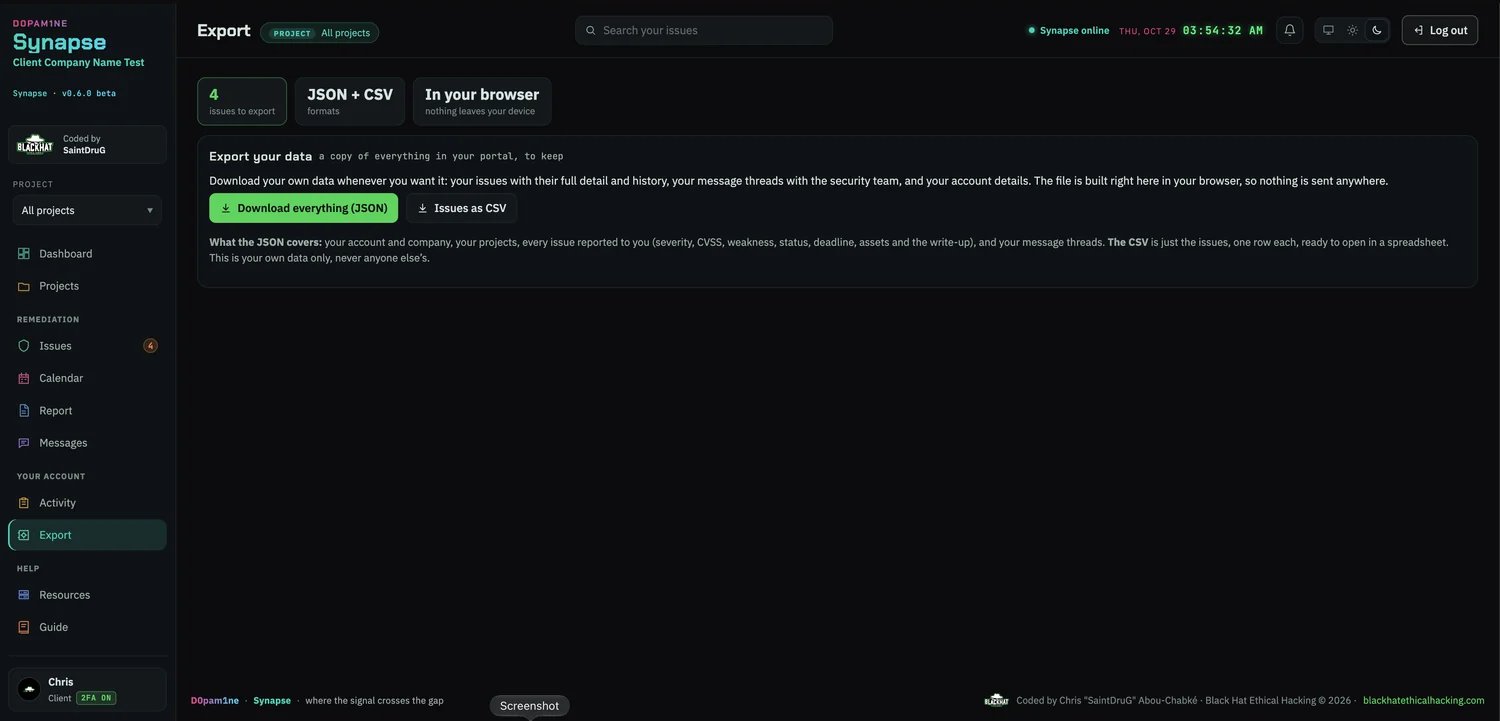
The Export page: a client downloads all their issues and messages as JSON, or their issues as a CSV, built in their browser.
Help and resources
The portal carries its own help, scoped to what a client can actually do here, so they rarely need to ask.- Resources is a page of short, practical cards: reading an issue, setting where an issue stands, requesting a retest, talking to your team, their report, exporting their data, keeping their account safe, and deadlines and SLAs.
- Guide is a full walkthrough of the portal, in the same flow and layout as the rest of this documentation: an issue is reported, the client reviews it, decides what to do, requests a retest, and it is closed, with a card for every section of the portal.
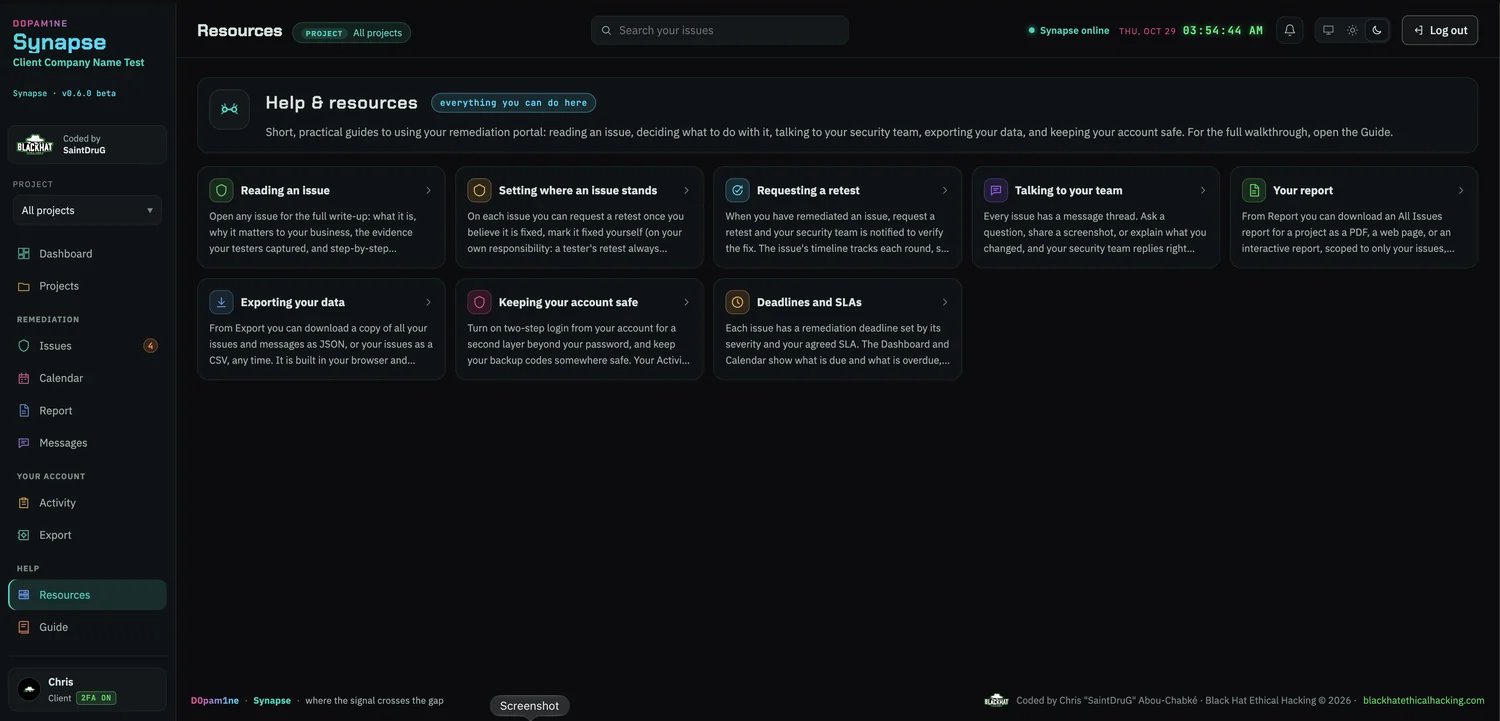
The portal Resources page: short, practical help cards covering everything a client can do in Synapse.
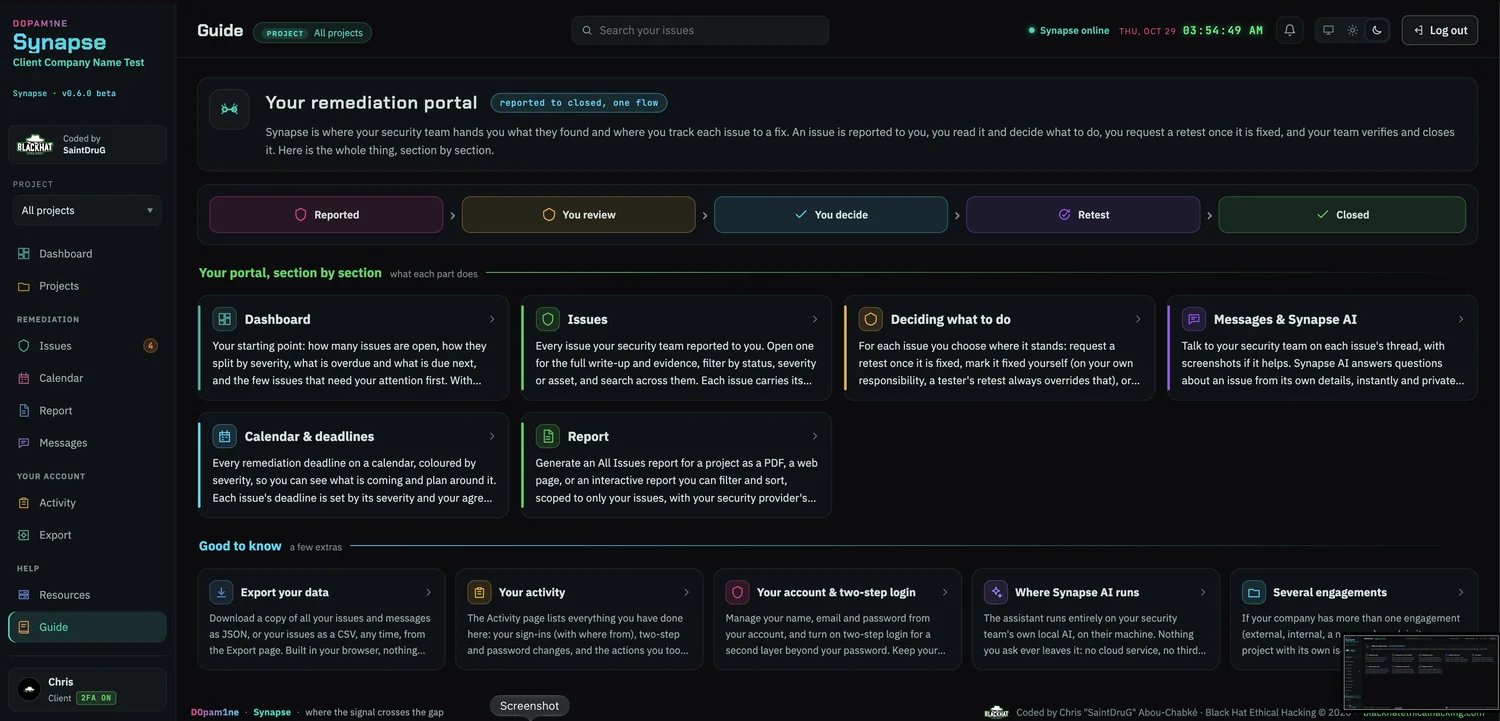
The portal Guide: the whole remediation flow, reported to closed, with a card for each part of the portal.
First visit
A new client is met with a short welcome tour that points out the overview, their issues, and how to talk to your team, so they can find their way without a call. Every step is listed down the left and can be jumped to, with the current one large on the right in its own colour. They can replay it later from their account menu.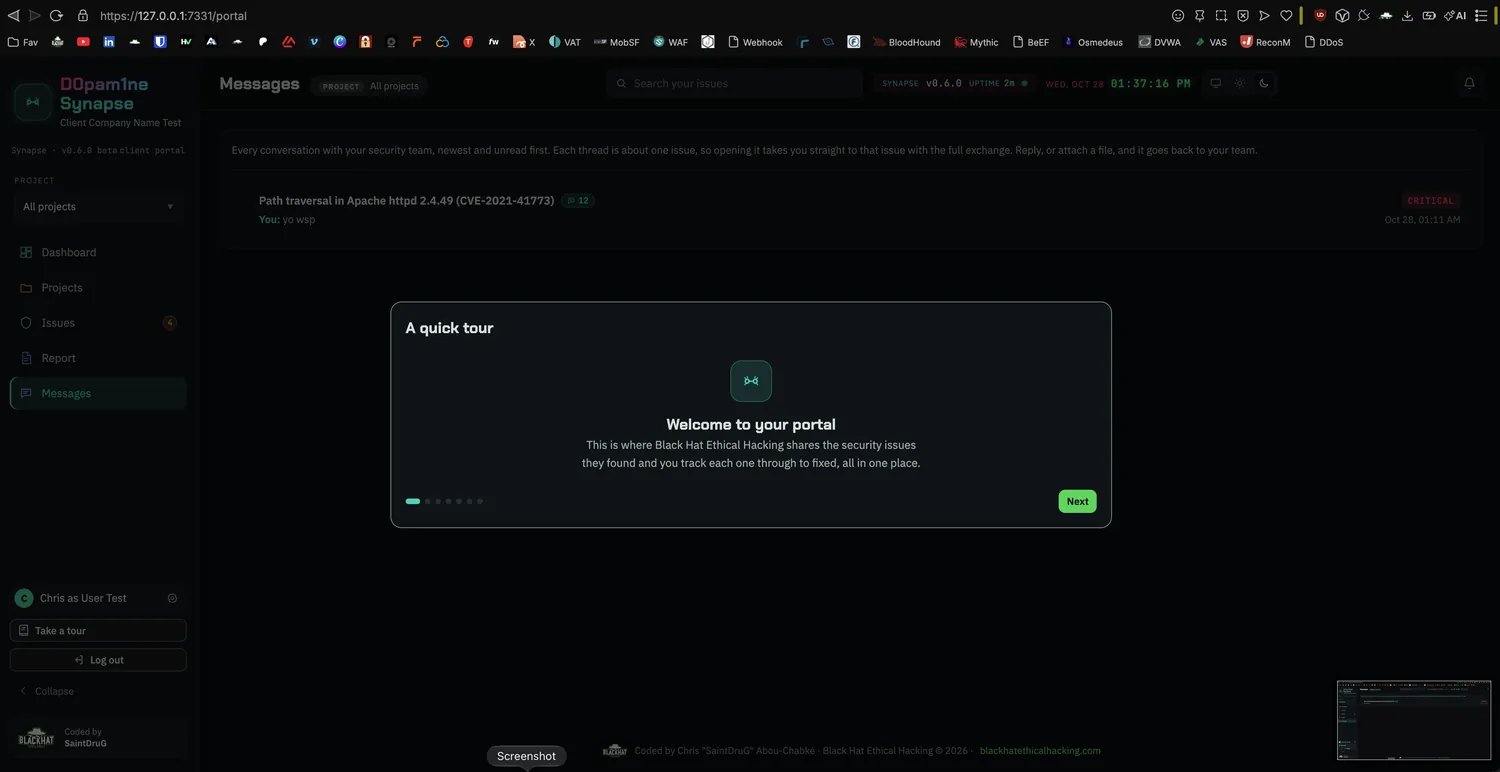
The portal welcome tour greets a new client and walks them through the overview, their issues, and how to reach your team.